Progressive Monte Carlo Rendering of Atmospheric Flow Features Across Scales
T. Günther, A. Kuhn, H.-C. Hege, M. Gross, H. TheiselGallery of Fluid Motion Posters, 69th Annual Meeting of the APS Division of Fluid Dynamics
Abstract
To improve existing weather prediction and reanalysis capabilities, high-resolution and multi-modal climate data becomes increasingly important. High-resolution numerical simulation of atmospheric phenomena provides new means to understand dynamic processes and to visualize structural flow patterns. In the presented figures, we demonstrate an advanced technique to visualize multiple scales of dense flow fields and Lagrangian patterns therein, simulated by state-of-the-art simulation models for each scale. They provide insight into the structural differences and patterns that occur on each scale and highlight the complexity of flow phenomena in our atmosphere. For visualization, we use an unbiased and consistent Monte Carlo rendering technique. The method approximates non-local flow integrals to derive the finite-time Lyapunov exponent (FTLE) field, which highlights areas of strong repelling behavior and denotes regions that cannot be crossed by virtual atmospheric tracers. These so-called material structures constrain the advection of trace gases (such as CO2 or SO2), guide temperature diffusion, and cloud formation. Overall, the Lagrangian perspective provides a novel view into the non-local, long-term dynamics of the atmospheric flow fields at each scale.Gallery
We demonstrate a method to visualize multiple scales of atmospheric flow fields and the Lagrangian patterns therein at highest quality. The simulations were computed with state-of-the-art simulation models for each atmospheric scale. For the visualizations, we used an unbiased and consistent Monte Carlo approach to avoid discretization of the finite-time Lyapunov exponent fields.
The following images are licensed under a Creative Commons Attribution 4.0 International License.
The 10.000 km Scale (global scale)

|

|
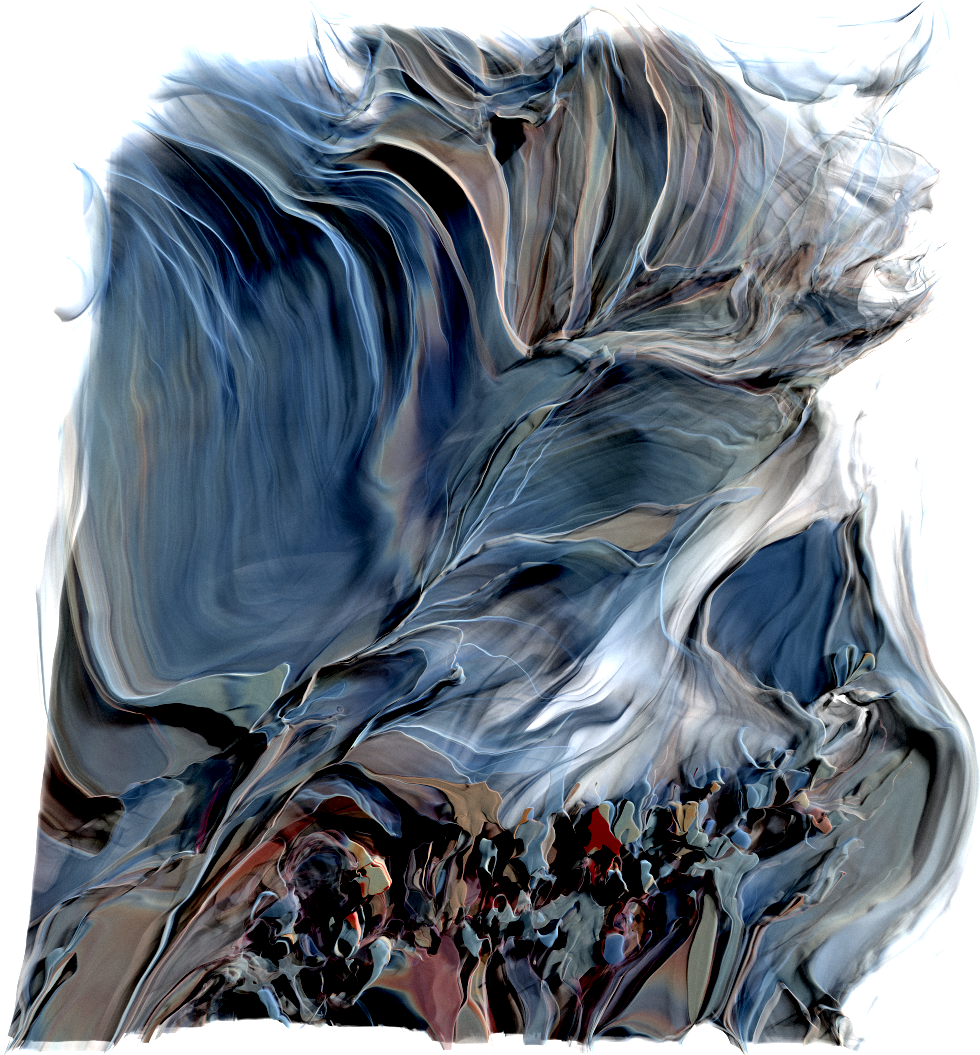
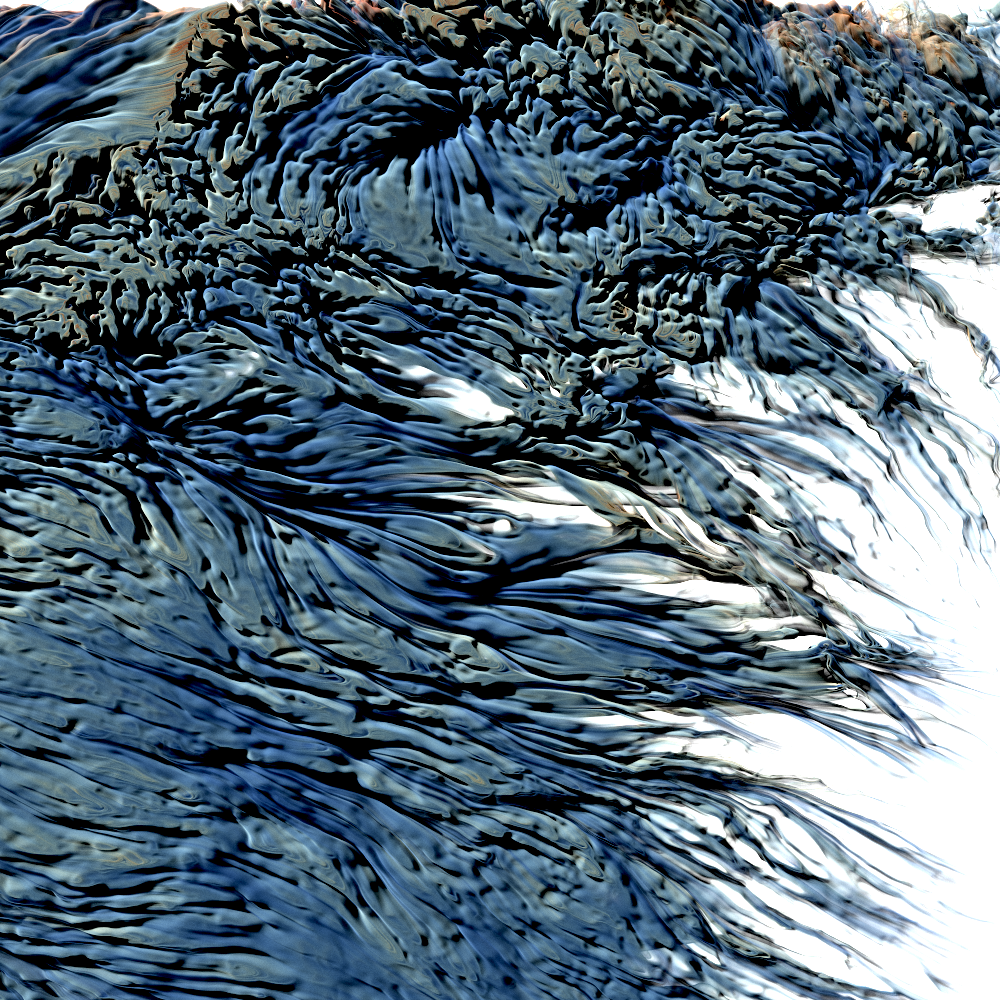
| This visualization shows a reanalysis simulation of the Northern hemisphere (data from the European Centre for Medium-Range Weather Forecasts), including the North American land surface, the North Atlantic Ocean and the European land mass. Here, the atmospheric flows are shown on a large scale. A close-up is shown on the right. Licensed under CC-BY 4.0. | |
The 1.000 km Scale (synoptic scale)

|

|
| The COSMO-DE reanalysis simulation displays the air flow over central Europe. The model is currently in operational use by the German Weather Service (DWD). At the synoptic scale, the flow patterns are strongly influenced by global-scale features, the land-sea interaction, and orography. Licensed under CC-BY 4.0. | |
The 100 km Scale (mesoscale)

|

|
| At the mesoscale, a semi-idealized large eddy simulation (LES) is shown for the area around Jülich, Germany, with a spatial resolution of 50m. The simulation was provided by Heinze et al. (doi:10.5194/acp-2016-498) and uses boundary forcing from the COSMO-DE model. Licensed under CC-BY 4.0. | |
The 10 km Scale

|

|
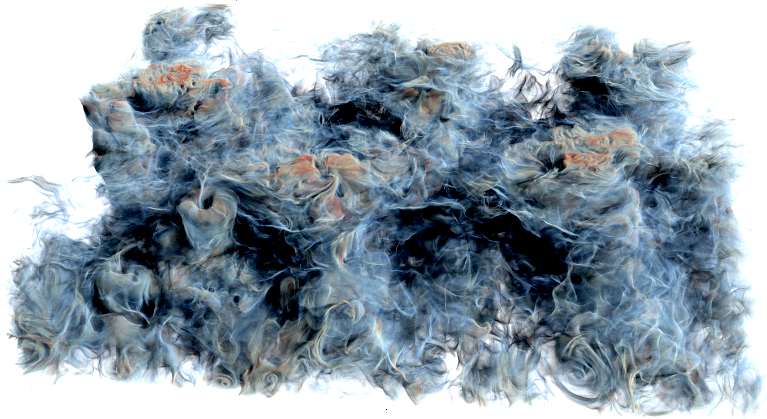
| The smallest scale displays a cloud-topped boundary layer simulation, created using the UCLA-LES model of Stevens et al. (doi:10.5194/acp-17-7083-2017). The simulation contains a cloud resolving domain with 25m spatial resolution under idealized conditions: It uses double-periodic boundary conditions and homogeneous surface forcing, while large-scale information is taken from the COSMO-DE model. Licensed under CC-BY 4.0. | |
Code
A demo implementation of the progressive renderer is available on GitHub.

